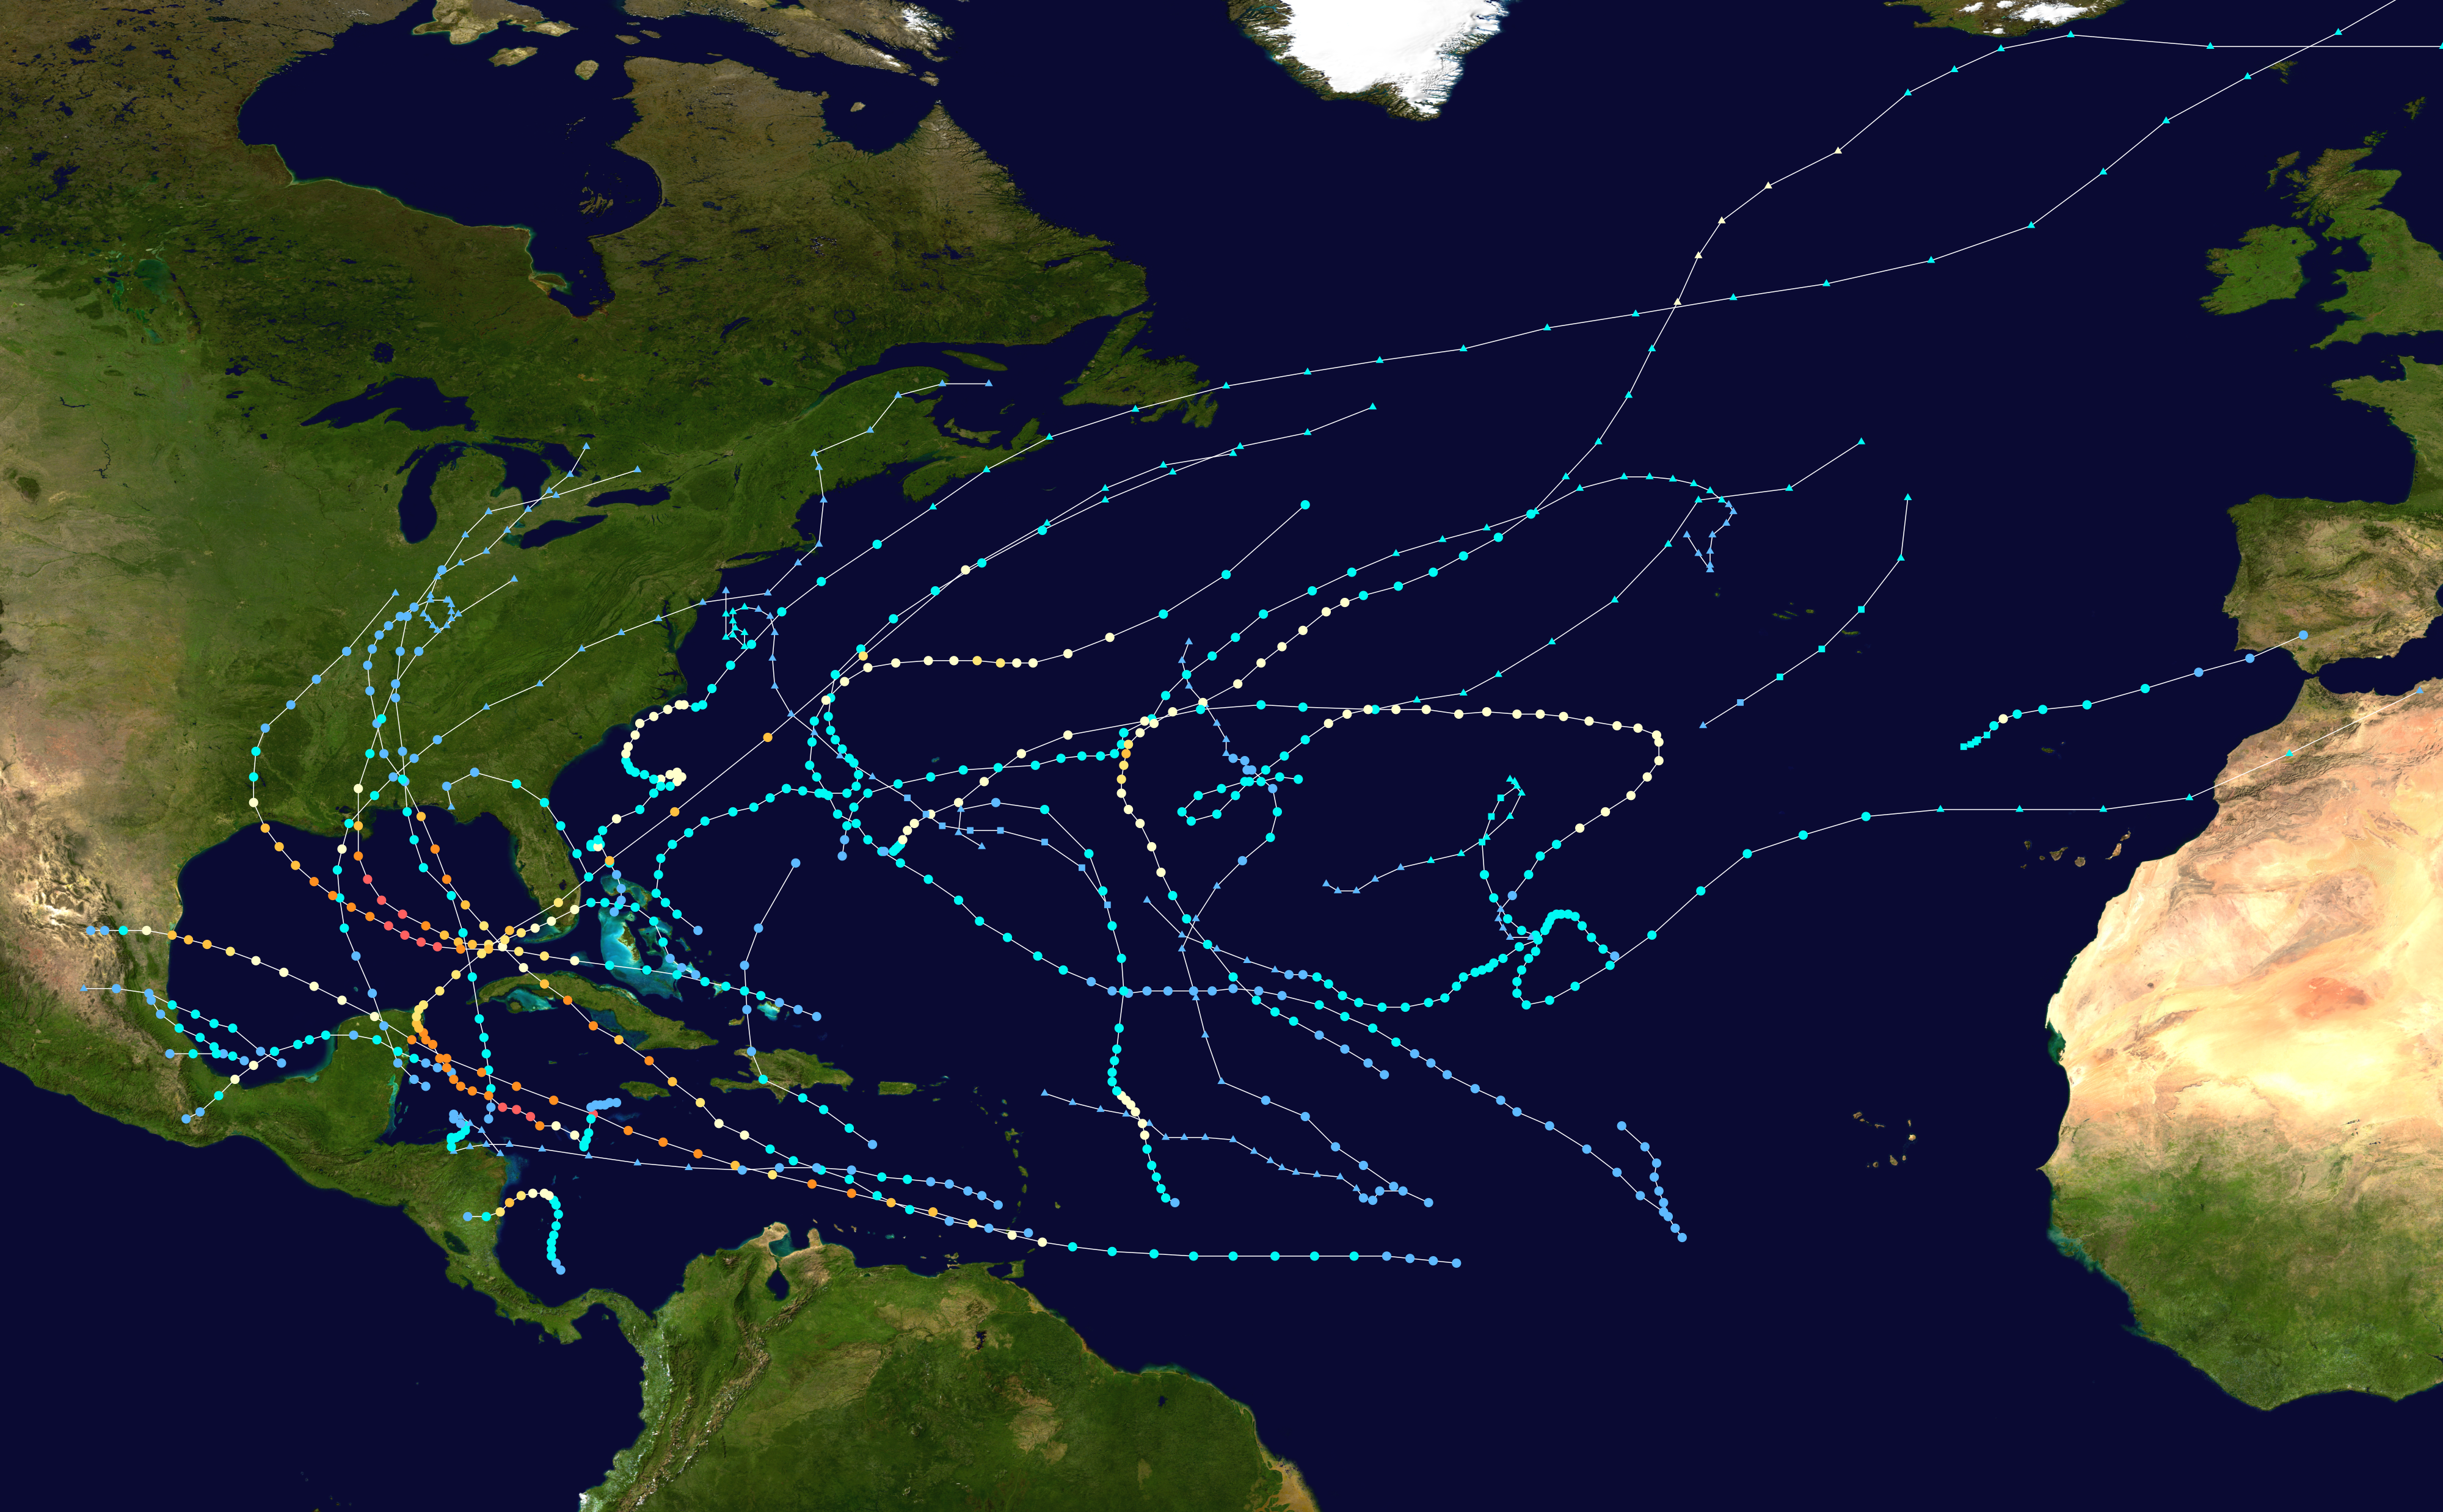
2005 Atlantic hurricane season
The 2005 Atlantic hurricane season was the most active year on record until surpassed by 2020. It featured 28[1] tropical or subtropical storms. The United States National Hurricane Center[nb 1] named 27 storms, exhausting the annual pre-designated list, requiring the use of six Greek letter names, and adding an additional unnamed storm during a post-season re-analysis. A record 15 storms attained hurricane status, with maximum sustained winds of at least 74 miles per hour (119 km/h). Of those, a record seven became major hurricanes, rated Category 3 or higher on the Saffir–Simpson scale. Four storms of this season became Category 5 hurricanes, the highest ranking.
2005 Atlantic hurricane season
June 8, 2005
January 6, 2006
(record latest, tied with 1954)
Wilma
(Most intense hurricane in the Atlantic basin)
185 mph (295 km/h)
(1-minute sustained)
31 (record high, tied with 2020)
28
15 (record high)
7 (record high, tied with 2020)
3,468 total
$172.297 billion (2005 USD)
(Second-costliest tropical cyclone season on record)
The four Category 5 hurricanes during the season were: Emily, Katrina, Rita, and Wilma. In July, Emily reached peak intensity in the Caribbean Sea, becoming the first Category 5 hurricane of the season, later weakening and striking Mexico twice. In August, Katrina reached peak winds in the Gulf of Mexico but weakened by the time it struck the U.S. states of Louisiana and Mississippi. The most devastating effects of the season were felt on the Gulf Coast of the United States, where Katrina's storm surge crippled New Orleans, Louisiana, for weeks and devastated the Mississippi coastline. Katrina became the costliest U.S. hurricane, leaving $125 billion in damage[nb 2] and 1,392 deaths. Rita followed in September, reaching peak intensity in the Gulf of Mexico before weakening and hitting near the border of Texas and Louisiana. The season's strongest hurricane, Wilma, became the most intense Atlantic hurricane on record, as measured by barometric pressure. Lasting for ten days in October, Wilma moved over Cozumel, the Yucatán Peninsula, and Florida, causing over $22 billion in damage and 52 deaths.
The season's impact was widespread and catastrophic. Its storms caused an estimated 3,468 deaths and approximately $172.3 billion in damage. It was the costliest season on record at the time, until its record was surpassed 12 years later. It also produced the second-highest accumulated cyclone energy (ACE) in the Atlantic basin, surpassed only by the 1933 season. The season officially began on June 1, 2005, and the first storm – Arlene – developed on June 8. Hurricane Dennis in July inflicted heavy damage to Cuba. Hurricane Stan in October was part of a broader weather system that killed 1,668 people and caused $3.96 billion in damage to eastern Mexico and Central America, with Guatemala hit the hardest. The final storm – Zeta – formed in late December and lasted until January 6, 2006.
Duration
June 8 – June 13
June 28 – June 30
July 3 – July 7
July 4 – July 13
July 11 – July 21
July 21 – July 29
July 23 – July 25
August 2 – August 8
August 4 – August 18
August 13 – August 14
August 22 – August 23
August 23 – August 30
August 28 – September 2
September 1 – September 10
September 5 – September 10
September 6 – September 17
September 17 – September 23
September 18 – September 26
September 30 – October 2
October 1 – October 5
October 4 – October 5
October 5 – October 6
October 8 – October 10
October 8 – October 11
October 15 – October 25
October 22 – October 24
October 26 – October 31
November 14 – November 21
November 22 – November 28
November 29 – December 8
December 30 – January 6