False discovery rate
In statistics, the false discovery rate (FDR) is a method of conceptualizing the rate of type I errors in null hypothesis testing when conducting multiple comparisons. FDR-controlling procedures are designed to control the FDR, which is the expected proportion of "discoveries" (rejected null hypotheses) that are false (incorrect rejections of the null).[1] Equivalently, the FDR is the expected ratio of the number of false positive classifications (false discoveries) to the total number of positive classifications (rejections of the null). The total number of rejections of the null include both the number of false positives (FP) and true positives (TP). Simply put, FDR = FP / (FP + TP). FDR-controlling procedures provide less stringent control of Type I errors compared to family-wise error rate (FWER) controlling procedures (such as the Bonferroni correction), which control the probability of at least one Type I error. Thus, FDR-controlling procedures have greater power, at the cost of increased numbers of Type I errors.[2]
History[edit]
Technological motivations[edit]
The modern widespread use of the FDR is believed to stem from, and be motivated by, the development in technologies that allowed the collection and analysis of a large number of distinct variables in several individuals (e.g., the expression level of each of 10,000 different genes in 100 different persons).[3] By the late 1980s and 1990s, the development of "high-throughput" sciences, such as genomics, allowed for rapid data acquisition. This, coupled with the growth in computing power, made it possible to seamlessly perform a very high number of statistical tests on a given data set. The technology of microarrays was a prototypical example, as it enabled thousands of genes to be tested simultaneously for differential expression between two biological conditions.[4]
As high-throughput technologies became common, technological and/or financial constraints led researchers to collect datasets with relatively small sample sizes (e.g. few individuals being tested) and large numbers of variables being measured per sample (e.g. thousands of gene expression levels). In these datasets, too few of the measured variables showed statistical significance after classic correction for multiple tests with standard multiple comparison procedures. This created a need within many scientific communities to abandon FWER and unadjusted multiple hypothesis testing for other ways to highlight and rank in publications those variables showing marked effects across individuals or treatments that would otherwise be dismissed as non-significant after standard correction for multiple tests. In response to this, a variety of error rates have been proposed—and become commonly used in publications—that are less conservative than FWER in flagging possibly noteworthy observations. The FDR is useful when researchers are looking for "discoveries" that will give them followup work (E.g.: detecting promising genes for followup studies), and are interested in controlling the proportion of "false leads" they are willing to accept.
Literature[edit]
The FDR concept was formally described by Yoav Benjamini and Yosef Hochberg in 1995[1] (BH procedure) as a less conservative and arguably more appropriate approach for identifying the important few from the trivial many effects tested. The FDR has been particularly influential, as it was the first alternative to the FWER to gain broad acceptance in many scientific fields (especially in the life sciences, from genetics to biochemistry, oncology and plant sciences).[3] In 2005, the Benjamini and Hochberg paper from 1995 was identified as one of the 25 most-cited statistical papers.[5]
Prior to the 1995 introduction of the FDR concept, various precursor ideas had been considered in the statistics literature. In 1979, Holm proposed the Holm procedure,[6] a stepwise algorithm for controlling the FWER that is at least as powerful as the well-known Bonferroni adjustment. This stepwise algorithm sorts the p-values and sequentially rejects the hypotheses starting from the smallest p-values.
Benjamini (2010) said that the false discovery rate,[3] and the paper Benjamini and Hochberg (1995), had its origins in two papers concerned with multiple testing:
The BH procedure was proven to control the FDR for independent tests in 1995 by Benjamini and Hochberg.[1] In 1986, R. J. Simes offered the same procedure as the "Simes procedure", in order to control the FWER in the weak sense (under the intersection null hypothesis) when the statistics are independent.[10]
is the number of true , an unknown parameter

null hypotheses
is the number of true

alternative hypotheses
is the number of rejected null hypotheses (also called "discoveries", either true or false)

If the tests are independent or positively correlated (as in Benjamini–Hochberg procedure):

Under arbitrary dependence (including the case of negative correlation), c(m) is the : .
Note that can be approximated by using the Taylor series expansion and the Euler–Mascheroni constant ():


harmonic number
Properties[edit]
Adaptive and scalable[edit]
Using a multiplicity procedure that controls the FDR criterion is adaptive and scalable. Meaning that controlling the FDR can be very permissive (if the data justify it), or conservative (acting close to control of FWER for sparse problem) - all depending on the number of hypotheses tested and the level of significance.[3]
The FDR criterion adapts so that the same number of false discoveries (V) will have different implications, depending on the total number of discoveries (R). This contrasts with the family-wise error rate criterion. For example, if inspecting 100 hypotheses (say, 100 genetic mutations or SNPs for association with some phenotype in some population):
PCER () is defined as: . Testing individually each hypothesis at level α guarantees that (this is testing without any correction for multiplicity)
![{\displaystyle \mathrm {PCER} =E\left[{\frac {V}{m}}\right]}](https://wikimedia.org/api/rest_v1/media/math/render/svg/c29dfa27a286355267f83672be2fc48110320d7b)

per-comparison error rate
FWER (the ) is defined as: . There are numerous procedures that control the FWER.

family-wise error rate
(The tail probability of the False Discovery Proportion), suggested by Lehmann and Romano, van der Laan at al, is defined as: .


is the proportion of false discoveries among the discoveries", suggested by Soric in 1989, and is defined as: . This is a mixture of expectations and realizations, and has the problem of control for .[1]

![{\displaystyle Q'={\frac {E[V]}{R}}}](https://wikimedia.org/api/rest_v1/media/math/render/svg/7f30d998838c4bd9f144d3cdfd88b0e7410c730b)

[9]
(or Fdr) was used by Benjamini and Hochberg, and later called "Fdr" by Efron (2008) and earlier.[21] It is defined as: . This error rate cannot be strictly controlled because it is 1 when .

![{\displaystyle \mathrm {FDR} _{-1}=Fdr={\frac {E[V]}{E[R]}}}](https://wikimedia.org/api/rest_v1/media/math/render/svg/53d466556dcaf918823cf48aa1b3f2917de7df70)

[3]
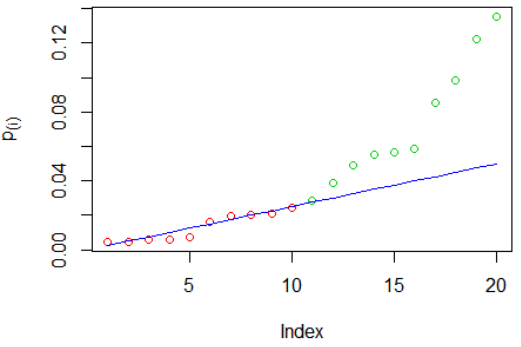
was used by Benjamini and Hochberg, and later called "pFDR" by Storey (2002).[22] It is defined as: . This error rate cannot be strictly controlled because it is 1 when . JD Storey promoted the use of the pFDR (a close relative of the FDR), and the q-value, which can be viewed as the proportion of false discoveries that we expect in an ordered table of results, up to the current line. Storey also promoted the idea (also mentioned by BH) that the actual number of null hypotheses, , can be estimated from the shape of the probability distribution curve. For example, in a set of data where all null hypotheses are true, 50% of results will yield probabilities between 0.5 and 1.0 (and the other 50% will yield probabilities between 0.0 and 0.5). We can therefore estimate by finding the number of results with and doubling it, and this permits refinement of our calculation of the pFDR at any particular cut-off in the data-set.[22]

![{\displaystyle \mathrm {FDR} _{+1}=pFDR=E\left[\left.{\frac {V}{R}}\right|R>0\right]}](https://wikimedia.org/api/rest_v1/media/math/render/svg/5c49e753d7dc0d06bdc0dcd08de990d9fbbea750)

[3]
False exceedance rate (the tail probability of FDP), defined as:

[23]
(Weighted FDR). Associated with each hypothesis i is a weight , the weights capture importance/price. The W-FDR is defined as: .


FDCR (False Discovery Cost Rate). Stemming from : associated with each hypothesis i is a cost and with the intersection hypothesis a cost . The motivation is that stopping a production process may incur a fixed cost. It is defined as:


statistical process control
PFER (per-family error rate) is defined as: .

FNR (False non-discovery rates) by Sarkar; Genovese and Wasserman is defined as:

is defined as:


The local fdr is defined as:

