Katana VentraIP

Fluorescence microscope

A fluorescence microscope is an optical microscope that uses fluorescence instead of, or in addition to, scattering, reflection, and attenuation or absorption, to study the properties of organic or inorganic substances.[1][2] "Fluorescence microscope" refers to any microscope that uses fluorescence to generate an image, whether it is a simple set up like an epifluorescence microscope or a more complicated design such as a confocal microscope, which uses optical sectioning to get better resolution of the fluorescence image.[3]

Light sources[edit]

Fluorescence microscopy requires intense, near-monochromatic, illumination which some widespread light sources, like halogen lamps cannot provide.[4] Four main types of light source are used, including xenon arc lamps or mercury-vapor lamps with an excitation filter, lasers, supercontinuum sources, and high-power LEDs. Lasers are most widely used for more complex fluorescence microscopy techniques like confocal microscopy and total internal reflection fluorescence microscopy while xenon lamps, and mercury lamps, and LEDs with a dichroic excitation filter are commonly used for widefield epifluorescence microscopes. By placing two microlens arrays into the illumination path of a widefield epifluorescence microscope,[5] highly uniform illumination with a coefficient of variation of 1-2% can be achieved.

Limitations[edit]

Fluorophores lose their ability to fluoresce as they are illuminated in a process called photobleaching. Photobleaching occurs as the fluorescent molecules accumulate chemical damage from the electrons excited during fluorescence. Photobleaching can severely limit the time over which a sample can be observed by fluorescence microscopy. Several techniques exist to reduce photobleaching such as the use of more robust fluorophores, by minimizing illumination, or by using photoprotective scavenger chemicals.


Fluorescence microscopy with fluorescent reporter proteins has enabled analysis of live cells by fluorescence microscopy, however cells are susceptible to phototoxicity, particularly with short wavelength light. Furthermore, fluorescent molecules have a tendency to generate reactive chemical species when under illumination which enhances the phototoxic effect.


Unlike transmitted and reflected light microscopy techniques, fluorescence microscopy only allows observation of the specific structures which have been labeled for fluorescence. For example, observing a tissue sample prepared with a fluorescent DNA stain by fluorescence microscopy only reveals the organization of the DNA within the cells and reveals nothing else about the cell morphologies.


Computational techniques that propose to estimate the fluorescent signal from non-fluorescent images (such as brightfield) may reduce these concerns.[8] In general, these approaches involve training a deep convolutional neural network on stained cells and then estimating the fluorescence on unstained samples. Thus by decoupling the cells under investigation from the cells used to train the network, imaging can performed quicker and with reduced phototoxicity.

A z-projection of an osteosarcoma cell, stained with phalloidin to visualise actin filaments. The image was taken on a confocal microscope, and the subsequent deconvolution was done using an experimentally derived point spread function.

A z-projection of an osteosarcoma cell, stained with phalloidin to visualise actin filaments. The image was taken on a confocal microscope, and the subsequent deconvolution was done using an experimentally derived point spread function.

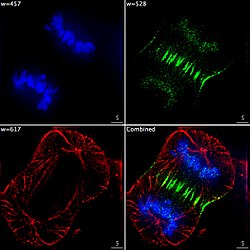
Epifluorescent imaging of the three components in a dividing human cancer cell. DNA is stained blue, a protein called INCENP is green, and the microtubules are red. Each fluorophore is imaged separately using a different combination of excitation and emission filters, and the images are captured sequentially using a digital CCD camera, then overlaid to give a complete image.

Epifluorescent imaging of the three components in a dividing human cancer cell. DNA is stained blue, a protein called INCENP is green, and the microtubules are red. Each fluorophore is imaged separately using a different combination of excitation and emission filters, and the images are captured sequentially using a digital CCD camera, then overlaid to give a complete image.

Endothelial cells under the microscope. Nuclei are stained blue with DAPI, microtubules are marked green by an antibody bound to FITC and actin filaments are labeled red with phalloidin bound to TRITC. Bovine pulmonary artery endothelial (BPAE) cells

Endothelial cells under the microscope. Nuclei are stained blue with DAPI, microtubules are marked green by an antibody bound to FITC and actin filaments are labeled red with phalloidin bound to TRITC. Bovine pulmonary artery endothelial (BPAE) cells

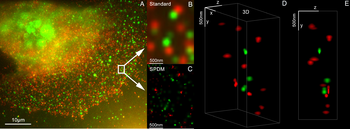
3D dual-color super-resolution microscopy with Her2 and Her3 in breast cells, standard dyes: Alexa 488, Alexa 568. LIMON microscopy

3D dual-color super-resolution microscopy with Her2 and Her3 in breast cells, standard dyes: Alexa 488, Alexa 568. LIMON microscopy

Human lymphocyte nucleus stained with DAPI with chromosome 13 (green) and 21 (red) centromere probes hybridized (Fluorescent in situ hybridization (FISH))

Human lymphocyte nucleus stained with DAPI with chromosome 13 (green) and 21 (red) centromere probes hybridized (Fluorescent in situ hybridization (FISH))

Yeast cell membrane visualized by some membrane proteins fused with RFP and GFP fluorescent markers. Imposition of light from both of markers results in yellow color.

Yeast cell membrane visualized by some membrane proteins fused with RFP and GFP fluorescent markers. Imposition of light from both of markers results in yellow color.

Super-resolution microscopy: Single YFP molecule detection in a human cancer cell. Typical distance measurements in the 15 nm range measured with a Vertico-SMI/SPDMphymod microscope

Super-resolution microscopy: Single YFP molecule detection in a human cancer cell. Typical distance measurements in the 15 nm range measured with a Vertico-SMI/SPDMphymod microscope

Super-resolution microscopy: Co-localization microscopy (2CLM) with GFP and RFP fusion proteins (nucleus of a bone cancer cell) 120.000 localized molecules in a wide-field area (470 μm2) measured with a Vertico-SMI/SPDMphymod microscope

Super-resolution microscopy: Co-localization microscopy (2CLM) with GFP and RFP fusion proteins (nucleus of a bone cancer cell) 120.000 localized molecules in a wide-field area (470 μm2) measured with a Vertico-SMI/SPDMphymod microscope

Fluorescence microscopy of DNA Expression in the Human Wild-Type and P239S Mutant Palladin.

Fluorescence microscopy of DNA Expression in the Human Wild-Type and P239S Mutant Palladin.

Fluorescence microscopy images of sun flares pathology in a blood cell showing the affected areas in red.

Fluorescence microscopy images of sun flares pathology in a blood cell showing the affected areas in red.

the database of fluorescent dyes

Fluorophores.org

Archived 22 October 2014 at the Wayback Machine

Microscopy Resource Center

(Université Paris Sud)

animations and explanations on various types of microscopes including fluorescent and confocal microscopes